


This article is about drawing a simple donut chart , using Google Charts
There are many Angular wrapper npm packages available. Here is one such wrapper for the Google Charts.
npm install angular-google-charts
After installation , proceed to import the Google Chart Module into the app.module.ts.
import { GoogleChartsModule } from "angular-google-charts";
imports: [
     GoogleChartsModule.forRoot()
]
In app.component.html, add the below selector
 <google-chart #chart
         [title]="title"
         [type]="type"
         [data]="data"
         [columnNames]="columnNames"
         [options]="options"
         [width]="width"
         [height]="height">
 </google-chart>
and pass the values in app.component.ts
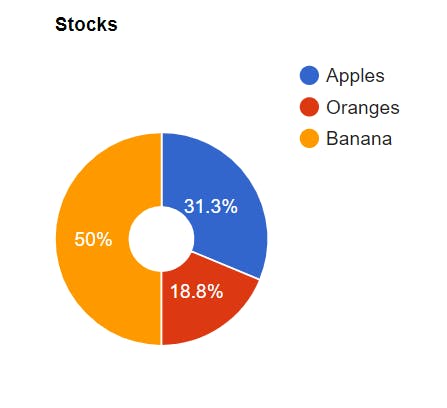
title = "Stocks";
type = 'PieChart';
width = 320;
height = 320;
columnNames = ['Name', 'Stocks'];
data: [string, number][] = [
    ['Apples', 5],
    ['Oranges', 3],
    ['Banana', 8]
];
options = {
    pieHole: 0.3 //this pieHole option makes the pieChart as Donut Chart
}
Output:
Customize the colors
options = {
    colors: ['green', 'pink', 'cyan'],
    pieHole: 0.3 //this pieHole option makes the pieChart as Donut Chart,
  }
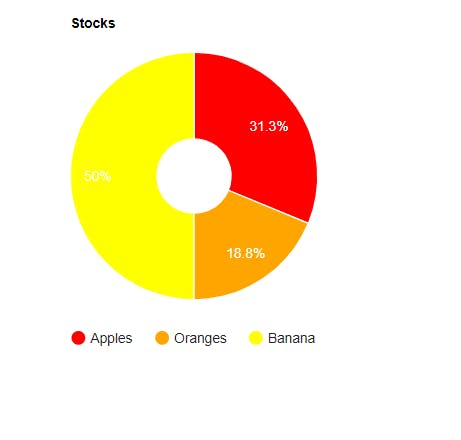
You can find more customizing options below: Customize the Legend
options = {
  legend: {
      position: 'bottom',
      alignment: 'start',
      maxLines: 5,
      textStyle: {
        color: 'grey',
        fontSize: 12
      }
    }
  }
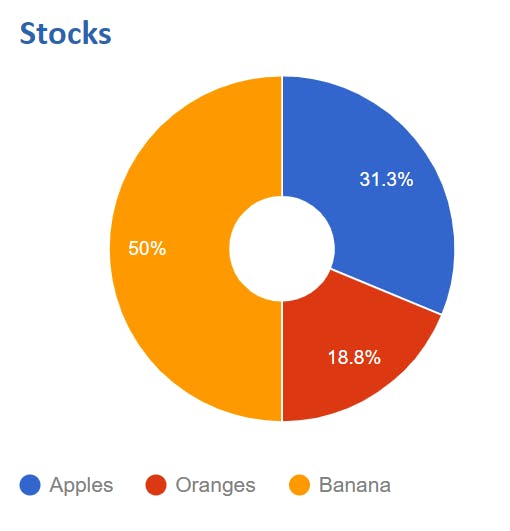
Customize the Title
options = {
      titleTextStyle: {
      color: '#2964af',
      fontName: 'calibri',
      fontSize: '20'
    }
}
Customize the chart
options: {
 chartArea: {
      width: '100%',
      height: '100%',
      top: 50,
      left: 10,
      right: 10
    }
}
Customize pieSliceText
options: {
    pieSliceText: 'label', // 'none', 'label', 'value', 'percentage'
}
For more options, Click here